
Monday, February 7, 2011
Tuesday, January 11, 2011
FlowTag

Author Chris Lee
Year -
Live
Year -
Live
Visualized activity Network Traffic Analysis
Visualization type Several graphs and visualizations
Local analysis
Local analysis
Interactive software capable to analyze traffic connected to your local net.
tnv: computer network traffic visualization tool

References http://tnv.sourceforge.net/index.php
Author Secure Decisions
Year -
Live
Year -
Live
Visualized activity Network Traffic Analysis
Visualization type Several graphs and visualizations
Local analysis
Local analysis
Interactive software capable to analyze traffic connected to your local net. Through visualization it helps to recognize the normal activity against the unexpected one potentially linked to a threat.
Interactive Network Active-traffic Visualization

References http://inav.scaparra.com/
Author Jeff Scaparra - Nathan Robinson
Year 2007
Live
Year 2007
Live
Visualized activity Network Connections
Visualization type Graph
Local analysis
Local analysis
Interactive software able to visualize in real time network dynamics starting from your machine. Analyzing incoming and outgoing flows the software draw graphs showing IP addresses and links between them.
SecureScope

References http://www.securedecisions.com/securescope
Author Secure Decisions
Year 2005
Year 2005
Visualized activity Network’s information security state
Visualization type Several 3D visualizations
Pay software
SecureScope visualizes the data produced by a wide range of security solutions, providing an integrated view of an entire network’s information security state.
Pay software
SecureScope visualizes the data produced by a wide range of security solutions, providing an integrated view of an entire network’s information security state.
MeerCAT

References http://www.securedecisions.com/meercat
Author Secure Decisions
Year -
Live
Year -
Live
Visualized activity Wireless networking
Visualization type Several graphics and visualizations
Local analysis
Pay software
Local analysis
Pay software
Interactive software able to locate and visualize wi-fi hotspots, their safety attributes, and reciprocal interactions.
VIAssist

References http://www.securedecisions.com/viassist
Author Secure Decisions
Year 2006
Live
Year 2006
Live
Visualized activity Network Traffic
Visualization type Several type of view
Local analysis
Pay software
Local analysis
Pay software
Interactive analysis software. Developed to increased security of your network through different graphics and visualizations it helps you to keep under control the activity flow in your net.
Titanium Internet Security 2011

Author Trend Micro
Year 2010
Periodic update
Year 2010
Periodic update
Visualized activity Malicious Activity
Visualization type Interactive Dashboard
Local analysis
Pay software
Local analysis
Pay software
Dashboard of Titanium antivirus with integrated graphic visualizations of your private network. Integration of visualization in antivirus dashboards is a growing phenomenal.
Norton Internet Security 2011

References Norton Internet Security 2011
Author Symantec
Year 2010
Periodic update
Year 2010
Periodic update
Visualized activity Malicious Activity
Visualization type Interactive dynamic geo-referenced
Global analysis
Pay software
Global analysis
Pay software
Dashboard of Norton antivirus with integrated graphic visualizations of your private network. In addiction on the bottom of the dashboard there is a interactive geo-referenced map updated every few minutes. Integration of visualization in antivirus dashboards is a growing phenomenal.
Spamology

References http://www.iradlee.com/projects/spamology/
Author Irad Lee
Year 2007
Year 2007
Visualized activity Spam
Visualization type Audio-video view
Visualizes the most used words in spam e-mails. Data are taken from a private archive with world figures from 1998 to 2007. Data are shown on a 3D view where the words are rectangular structures. The different height is due to the number of times the words are repeated year by year.
SpamVisualization

References http://spamvisualization.net/
Author Kim Asendorf - kaubonschen creative studio
Year 2009
Live
Year 2009
Live
Visualized activity Spam
Visualization type Several interactive visualizations
Analysis and visualization tool. Starting from a database (Spam Catalog), created by the author, gives back the informations as different types of interactive visualizations.
Malware: Troyak-AS and Peer activity

Author Jaime Blasco
Year 2010
Year 2010
Visualized activity Troyak-AS
Visualization type Series of static graphs
Series of graphs showing the presence of Troyak-AS malware through the visualization of the activity in the Autonomous System connected to it.
Respam

References http://sq.ro/respam.php
Author Alex Dragulescu
Year -
Year -
Visualized activity Spam
Visualization type Static graph
Net art visualization of spam activity between several different email addresses. The map is shown as a multigraph. Multigraph are often used to visualize nets.
Malta Info Security

Author ThreatExpert Ltd.
Year 2007
Year 2007
Visualized activity Malicious Activity
Visualization type Multi-line chart
Report of net crimes recorded on the isle of Malta in 2007. They are visualized on a multi-line chart.
Spectral view on activity

References https://www.clarifiednetworks.com/ClarifiedVisualizationGallery#Situation_Rooms_-_Intuitive_views
Author Clarified networks
Year -
Year -
Visualized activity Bot
Visualization type Activity spectrum
Visualizing botnet by activity spectrum (y-axis is the latitude, x-axis time, color the amount of activity). Through it you can see cyclical activity in a period of time, over the three main continents: USA, Europe and Asia.
NoAH.honeypots TrGeo

References https://stats.fp6-noah.org/trgeo.php
Author NoAH - Forth ICS - DCS Lab
Year July 2008
Live
Year July 2008
Live
Visualized activity Malicious Activity
Visualization type Interactive dynamic geo-referenced
Live dynamic worldmap. When you open it, it starts to show you the threats in real time. It is based on the Honeypots principle. In the bottom of the view are shown two other graphs.
Akamai Real-time Web Monitor

Author Akamai
Year 2007
Live
Year 2007
Live
Visualized activity Malicious Activity
Visualization type Interactive dynamic geo-referenced
Interactive dynamic geo-referenced map where attacks are shown in real time collected by nations. The user can also choose to show other parameters (latency and traffic) on the map.
The World Threat Atlas

References http://www.threatexpert.com/map.aspx
Author ThreatExpert Ltd.
Year 2009
Periodic update
Year 2009
Periodic update
Visualized activity Malicious Activity
Visualization type Interactive dynamic geo-referenced
Interactive map. Clicking on a single state a report is shown with names given to threats.
Spam senders

Author Australian Honeynet Project
Year 2009
Year 2009
Visualized activity Spam
Visualization type Dynamic geo-referenced
In this video map each single sent spam is visualized with a small red dot. The sum of all of those draw the dynamic map of a specific period of time.
Internet malicious activity World Map

Internet malicious activity Hilbert Map
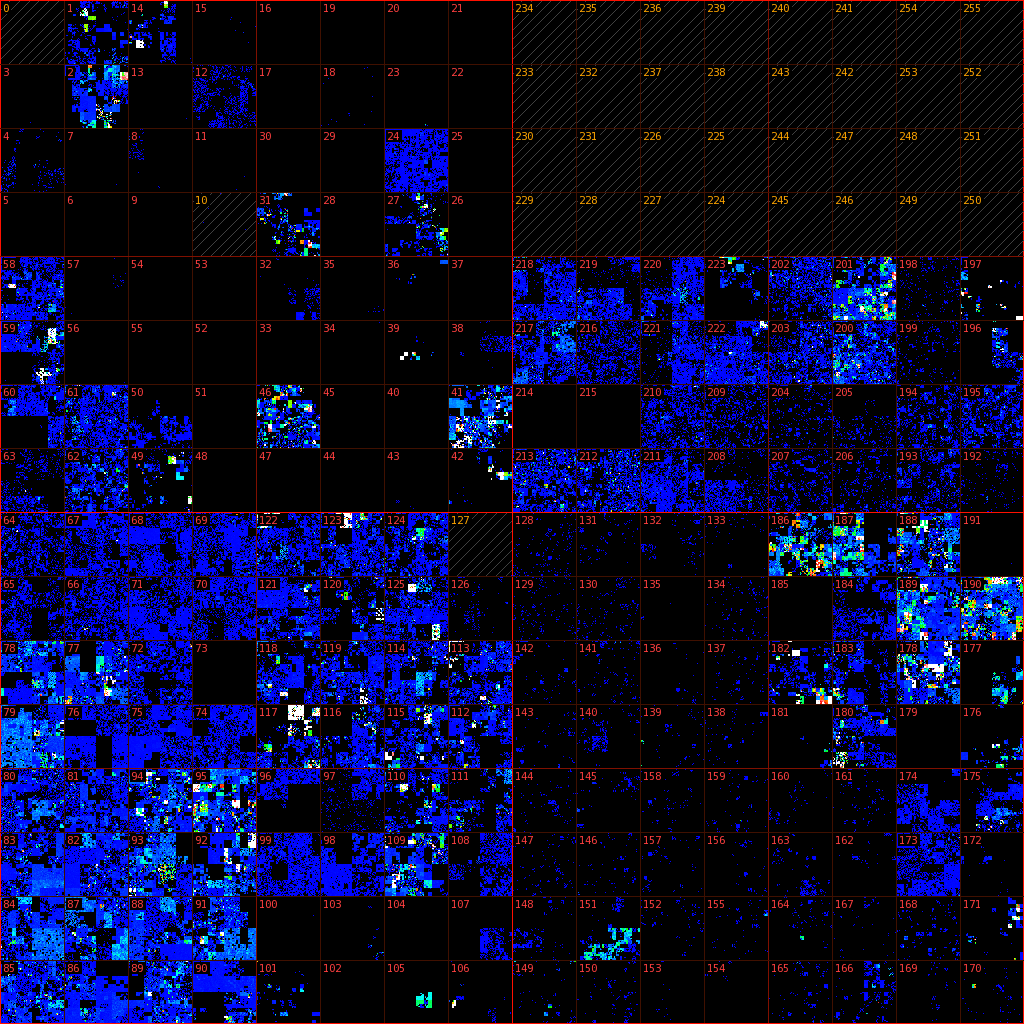
Author Team Cymru
Year -
Daily update
Year -
Daily update
Visualized activity Malicious Activity
Visualization type Static
Automatic updating map of malicious activity. The map is daily updated and showing the last 30 days of activity. Each cell shows a different area in the world, the number identifies the first part of the IP address. The color shows the different intensity of malicious activity.
Conficker Worm Visualizations

Author Team Cymru
Year January 2009
Year January 2009
Visualized activity Conficker Worm
Visualization type Static geo-referenced
Visualization of IP addresses infected from the Confiker worm on January 29, 2009. The number of attacks is so high to draw the map of continents.
Tuesday, December 28, 2010
When Bots Attack

References Wired US Magazine 15.09 http://www.wired.com/politics/security/magazine/15-09/ff_estonia_bots
Author Catalogtree and Systemantics
Year Published on September 2007
Visualized activity Bot
Visualization type Static geo-referenced
Flow visualization of a botnet malicious attack. Using rented botnets, you can launch hundreds of thousands — even millions — of infobombs at a target, all while maintaining total deniability. Once the net is ready, once single "go" is sufficient to blow up an istantaneous attack from millions of machines.
Subscribe to:
Comments (Atom)