Author Team Cymru
Year -
Daily update
Year -
Daily update
Visualized activity Malicious Activity
Visualization type Static
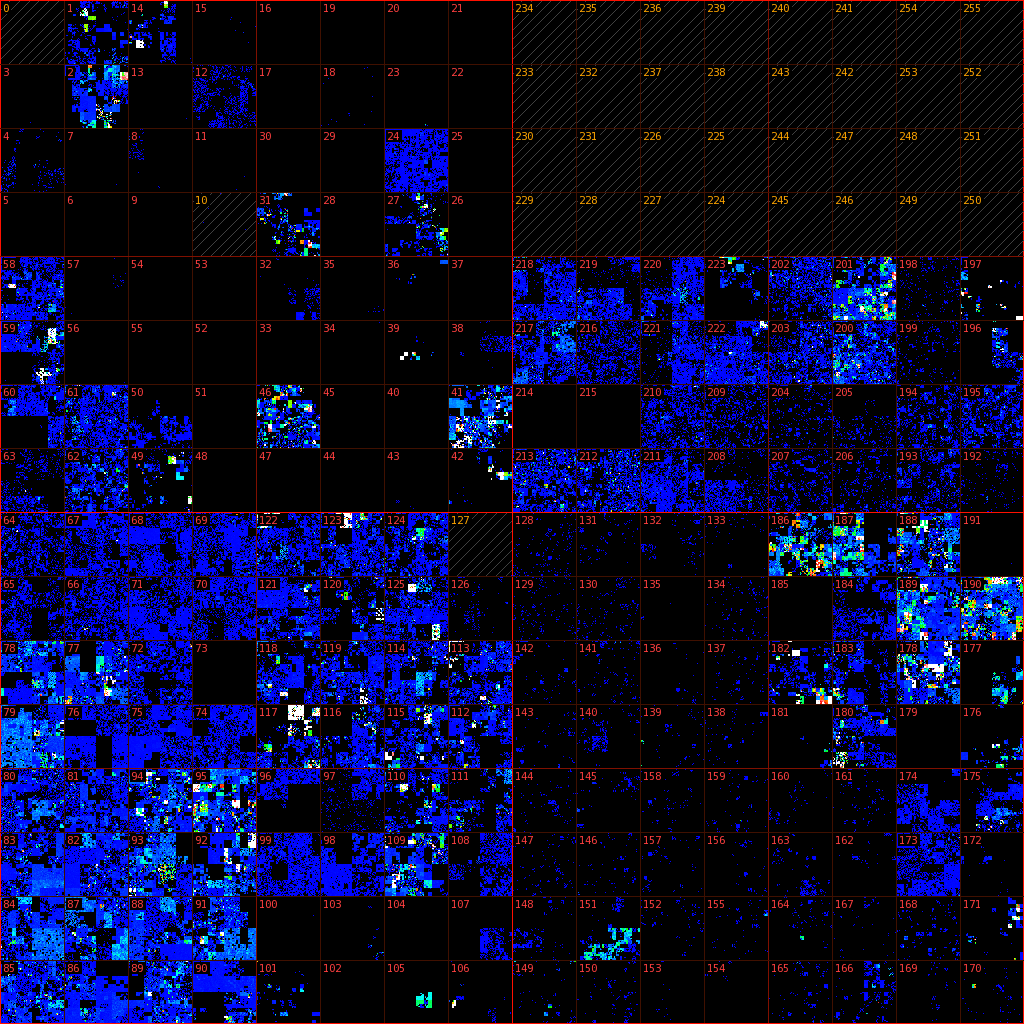
Automatic updating map of malicious activity. The map is daily updated and showing the last 30 days of activity. Each cell shows a different area in the world, the number identifies the first part of the IP address. The color shows the different intensity of malicious activity.
No comments:
Post a Comment